Build data analyst dashboard using Data Warehouse
- 6 minsContinuing the series of articles on the Data Warehouse topic, today we will come to a quite interesting content which is building a Data Analysis Dashboard on the Data warehouse. Building a Data Analysis Dashboard is one of the most basic functions in BI (Business Intelligence) activities, helping to visualize data in the form of charts, thereby helping users to easily understand and see insights from the data.
You can use Chainslake, a blockchain data warehouse that allows users to query blockchain data, build and share blockchain data analysis dashboards completely free of charge.
Contents
- Overview of Metabase
- Install and configure Metabase to connect to Data warehouse
- Data tables in data warehouse
- Query data, build and share dashboard
- Conclusion
I am currently consulting, designing and implementing data analysis infrastructure, Data Warehouse, Lakehouse for individuals and organizations in need. You can see and try a system I have built here. Please contact me via email: lakechain.nguyen@gmail.com. Thank you!
Overview of Metabase
Metabase is a BI tool that allows querying data using SQL language on many different databases and SQL engines through plugins, presenting query results into tables, charts, data on analytical dashboards, you can see a demo dashboard of mine here.
Metabase has both an Opensource version with basic functions that can be installed on existing infrastructure and an Enterprise version with advanced functions that can be used directly on Metabase’s cloud or self-hosted via a license key. You can see details here.
Install and configure Metabase to connect to Data warehouse
I will install the Opensource version of Metabase via docker and connect to our DWH cluster via Trino (you can review my article on how to install Trino here)
First, I will create a database for Metabase in postgres on the DWH cluster
postgres=# CREATE DATABASE metabase;
Install metabase via Docker
$ wget https://github.com/starburstdata/metabase-driver/releases/download/5.0.0/starburst-5.0.0.metabase-driver.jar
$ docker run -d -p 3000:3000 --name metabase \
  --network hadoop --add-host=node01:172.20.0.2 \
  -e "MB_DB_TYPE=postgres" \
  -e "MB_DB_DBNAME=metabase" \
  -e "MB_DB_PORT=5432" \
  -e "MB_DB_USER=postgres" \
  -e "MB_DB_PASS=password" \
  -e "MB_DB_HOST=node01" \
  -v starburst-5.0.0.metabase-driver.jar:/plugins/starburst-5.0.0.metabase-driver.jar \
   --name metabase metabase/metabase
Note
172.20.0.2is the container ip of node01 on my machine, you replace it with your machine ip.
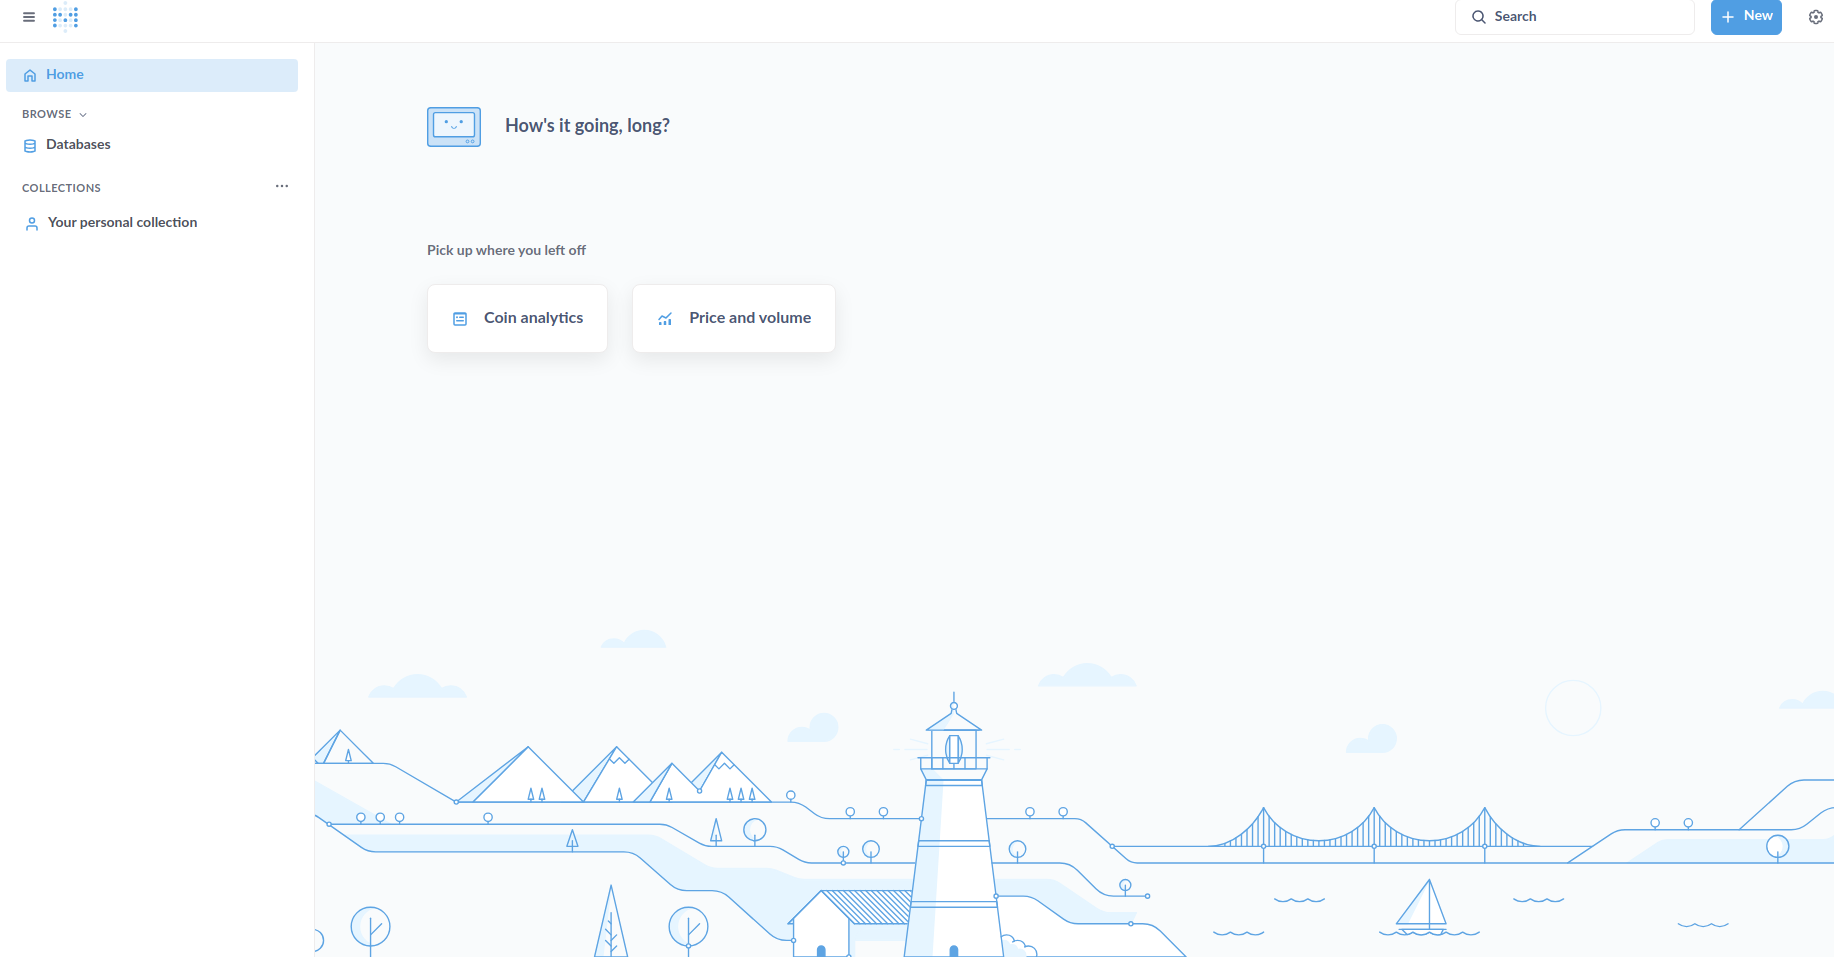
Access http://localhost:3000 you will see the Metabase startup interface, after creating an admin account you will be taken to the main working interface of Metabase.
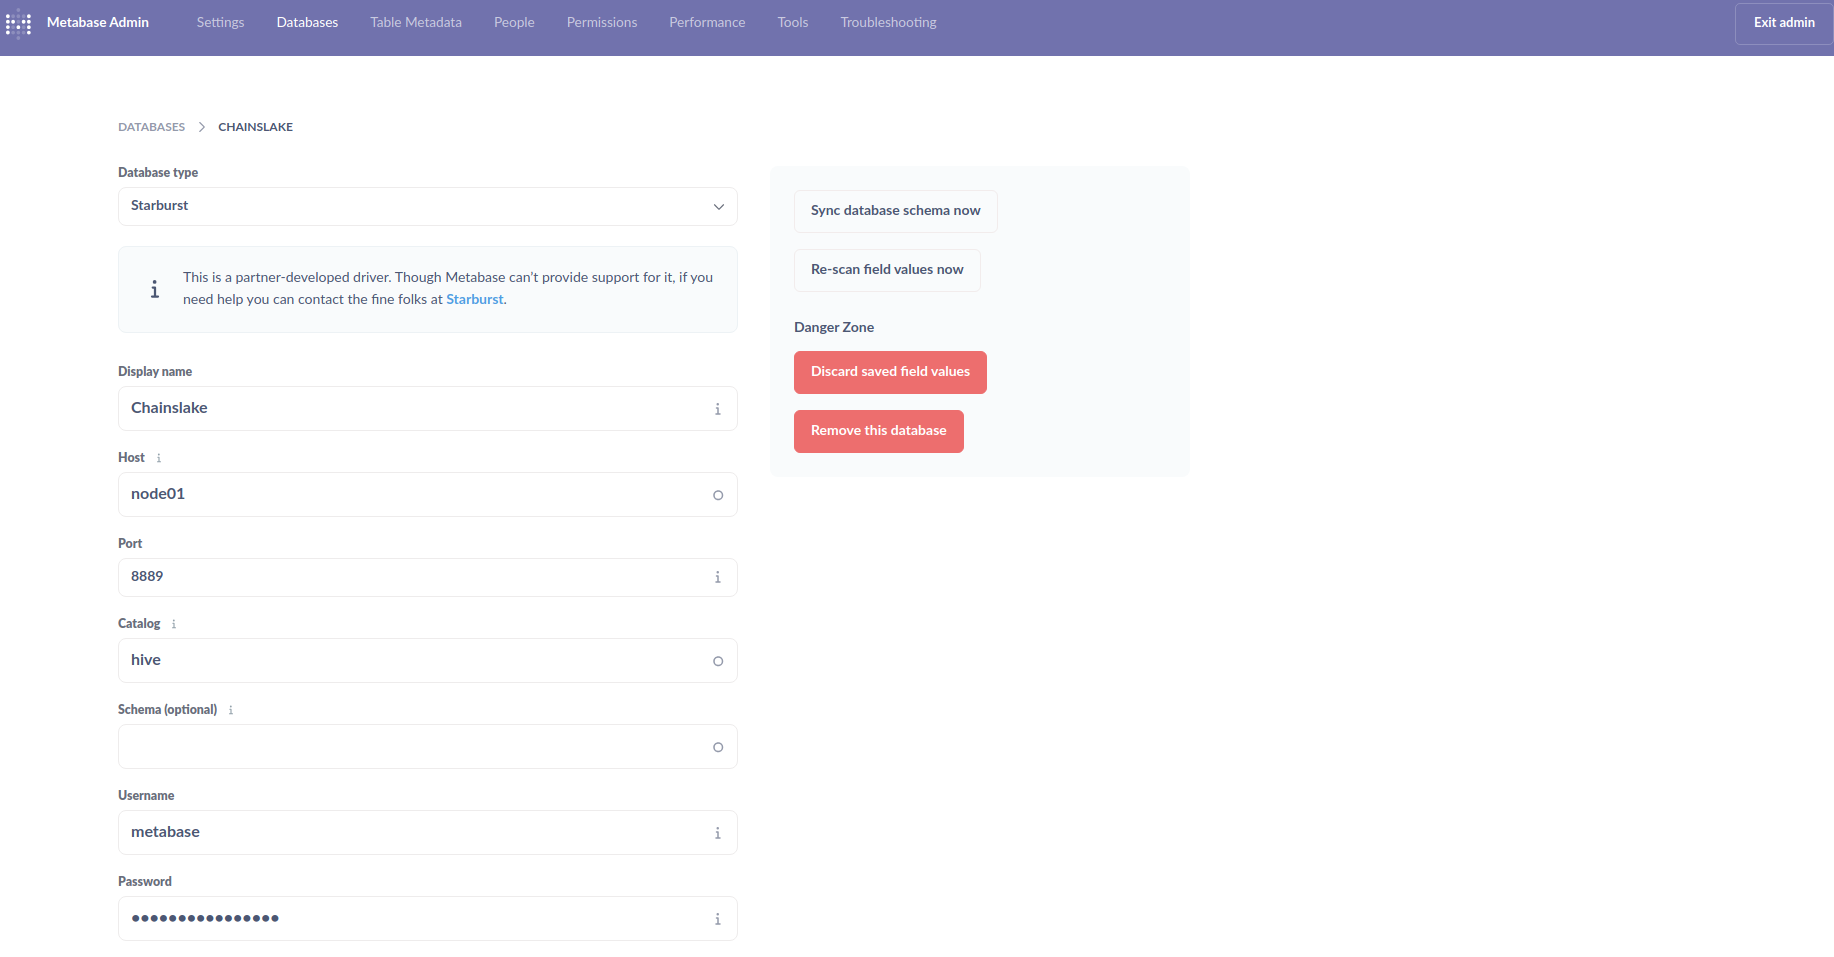
To connect to Trino, go to Admin settings, select the Databases tab, select Add database and set it up as shown below:
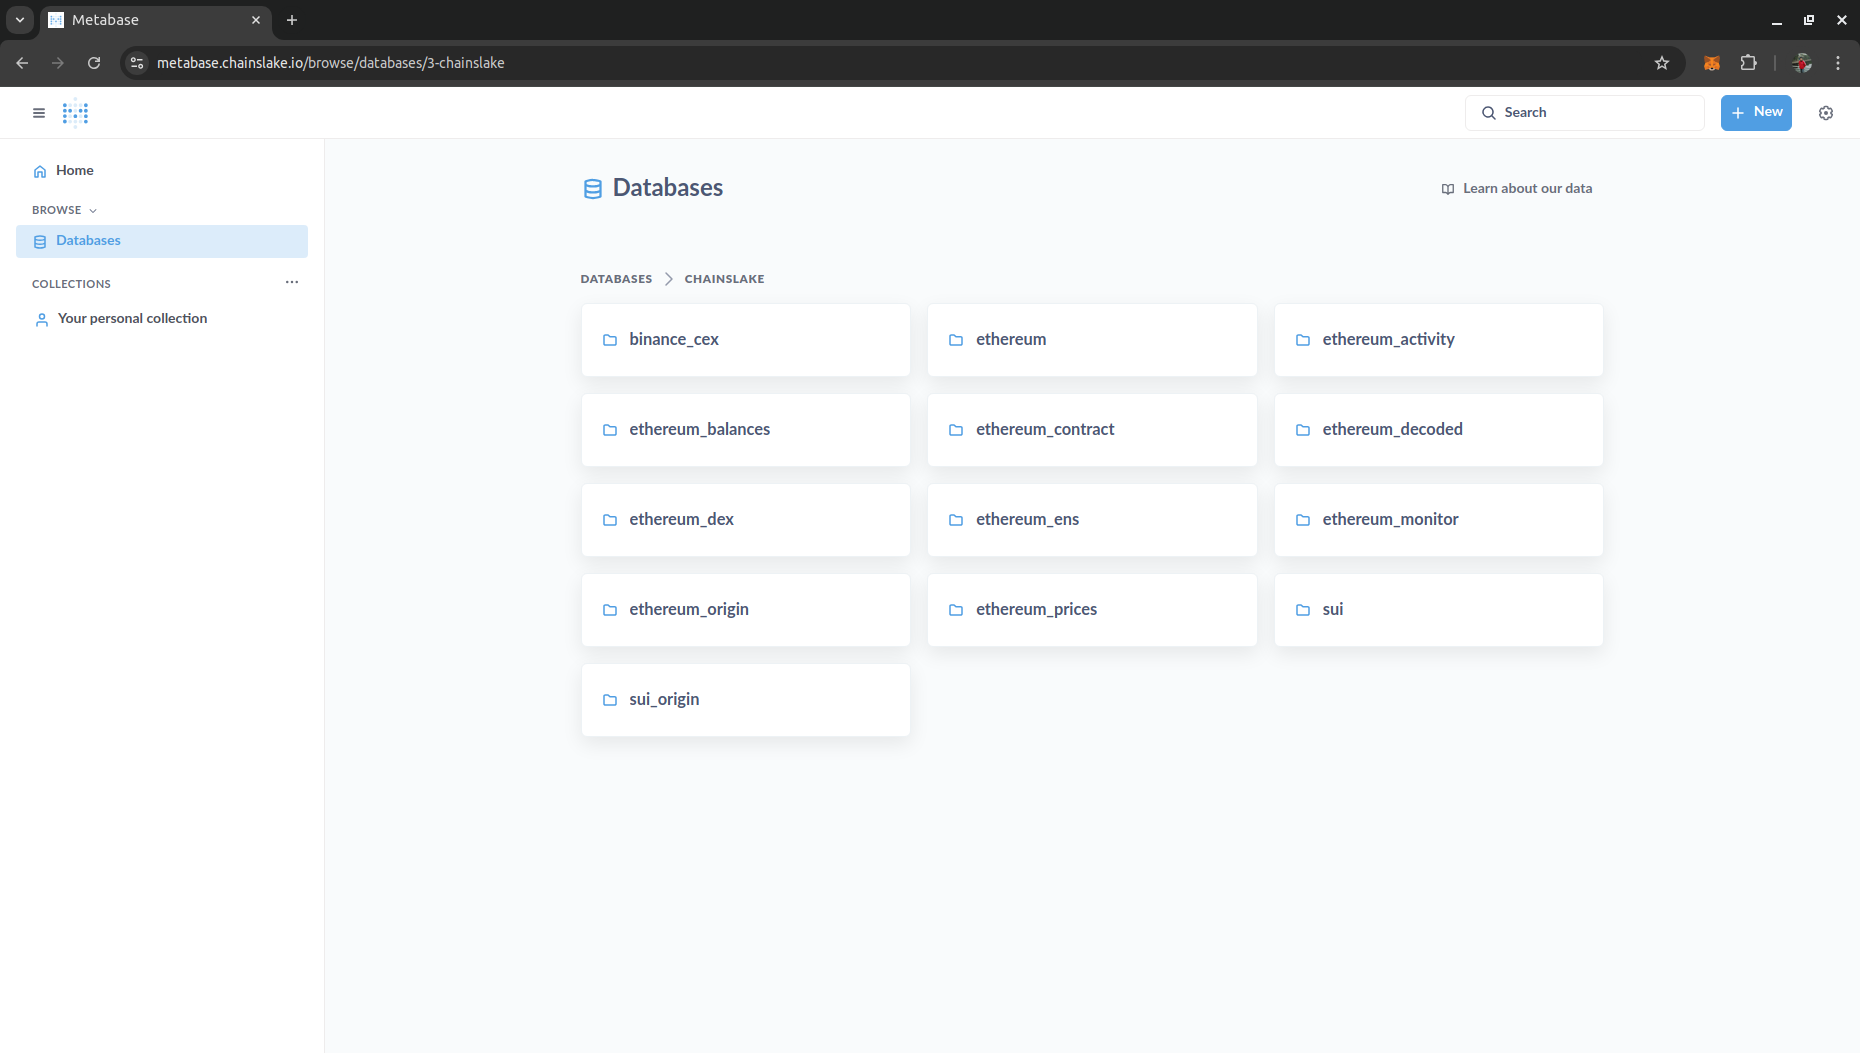
After configuring, Exit admin and check if there is data in Browser/Databases. You can see Chainslake’s data tables here
Data tables in the data warehouse
In this section, I will briefly describe the data tables in the data warehouse of Chainslake to have a basis for writing queries and building dashboards in the next section.
Chainslake’s data warehouse includes many folders, each folder includes many tables with the same topic, specifically I will introduce some of the following tables and folders:
-
ethereum: Folder containing Ethereum raw data (You can learn more about the data types of Ethereum blockchain in my previous article here)
- transactions: Contains all transaction data on Ethereum (from the beginning to the present)
- logs: Contains all log data (events) emitted from contracts when they execute transactions.
- traces: Contains all Internal Transactions data (The smallest transaction units on Ethereum).
-
address_type: Contains all addresses that have ever appeared on Ethereum, including 2 types:
walletandcontract
-
ethereum_decoded: Directory containing decode data of some protocols on Ethereum. Currently, Chainslake has decode data of some popular protocols as follows:
- erc20_evt_transfer: ERC20 token transfer data (all tokens from the past to present)
- erc721_evt_transfer: ERC721 NFT transfer data
- erc1155_evt_transferbatch, erc1155_evt_transfer_single: NFT 1155 transfer data
- uniswap_v2_evt_swap, uniswap_v3_evt_swap: Token swap data on liquidity pools.
-
ethereum_contract: Contains all contract information of some popular protocols
- erc20_tokens: Information about ERC20 tokens.
- erc721_tokens: Information about ERC721 NFTs.
- erc1155_tokens: Information about ERC1155 NFTs.
- uniswap_v2_info, uniswap_v3_info: Information about Swap pool contracts (Uniswap and other protocols with the same standard)
-
ethereum_dex: Contains trading data of ERC20 tokens on DEX decentralized exchanges.
- token_trades: Contains trading data of ERC20 tokens on DEX decentralized exchanges with WETH.
-
ethereum_prices: Contains data on token prices according to transactions taken from DEX data.
- erc20_usd_day, erc20_usd_hour, erc20_usd_minute: ERC20 token prices in usd by day, hour, minute.
-
ethereum_balances: Directory containing information on balances, balance fluctuations of addresses on Ethereum
- erc20_native: Summary table of final balances and daily balance fluctuations of all addresses of all tokens including Native tokens on Ethereum.
-
binance_cex: Table containing transaction price data of coins on Binance exchange
- coin_token_address: List of coins listed on Binance exchange that have corresponding tokens on Ethereum
- trade_minute: Price data of trading pairs by minute on Binance.
Query data, build and share dashboards
Writing queries and building dashboards on Chainslake is quite simple if you already have SQL skills. I have created a dashboard in the collection Demo so you can understand and easily start creating your own analytical dashboards.
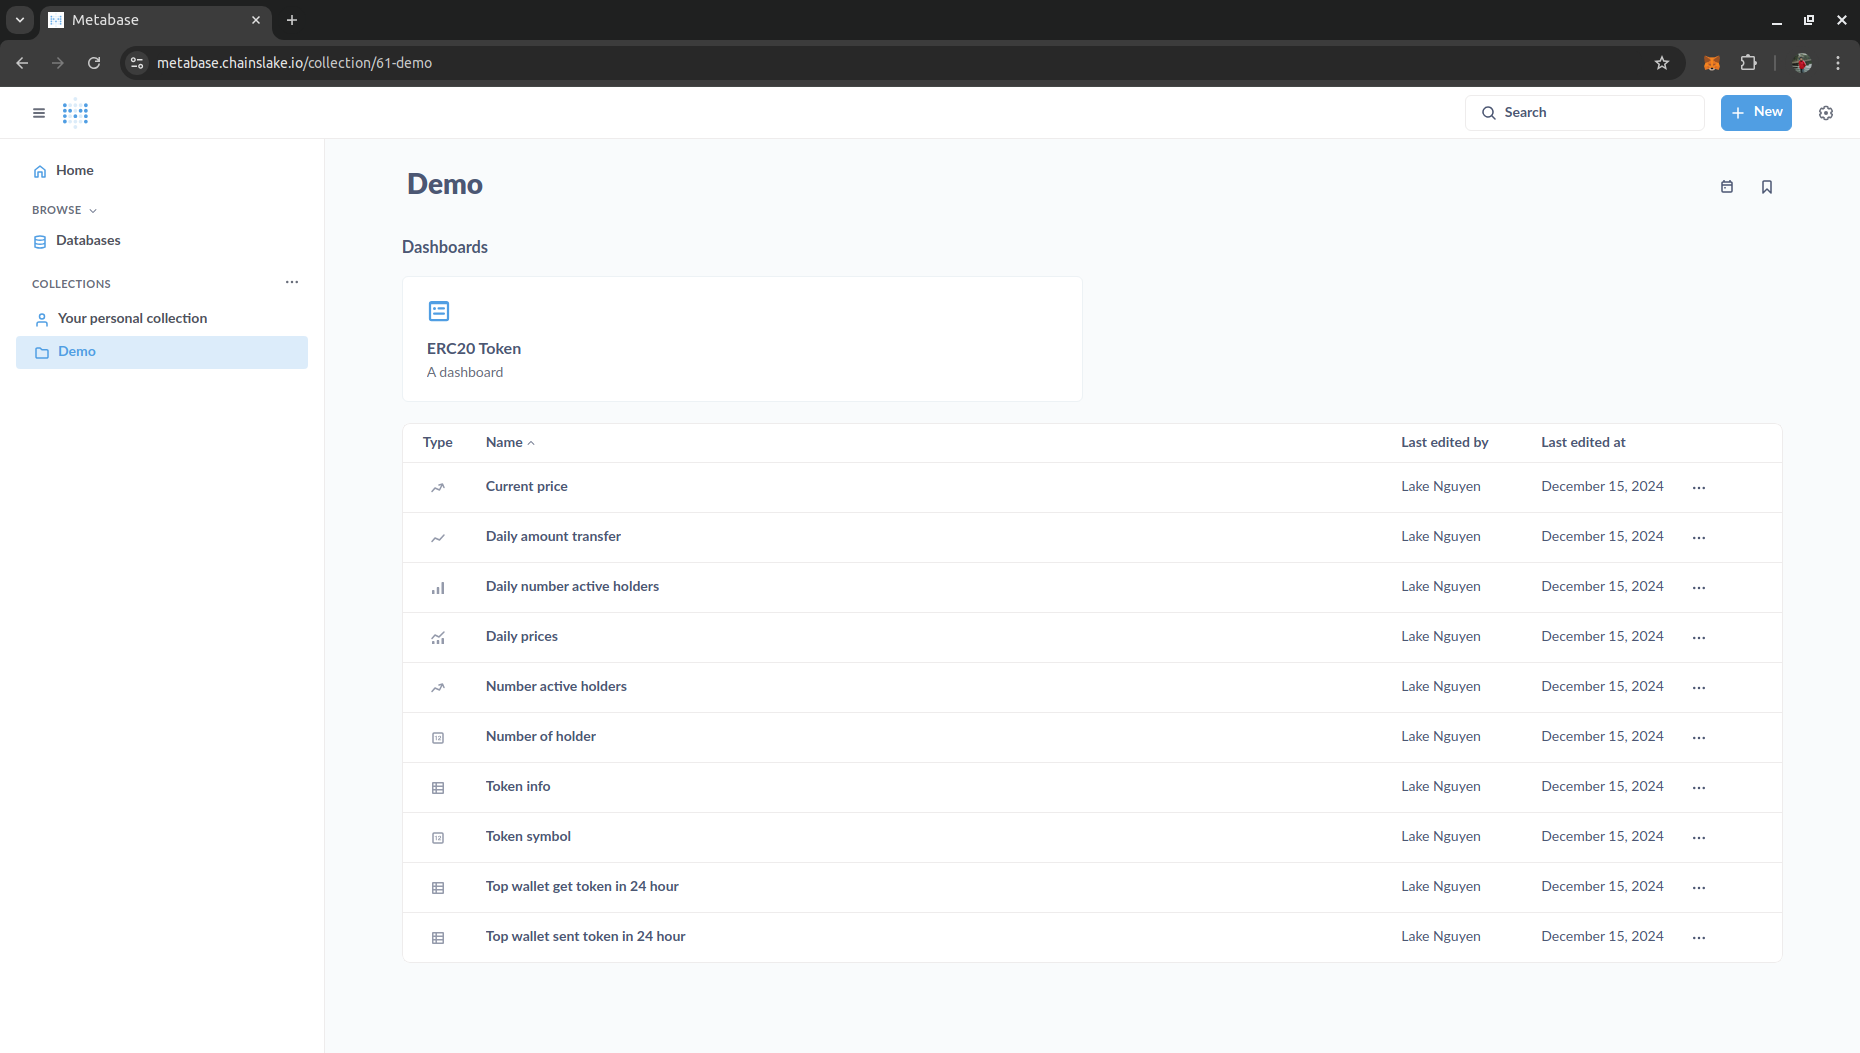
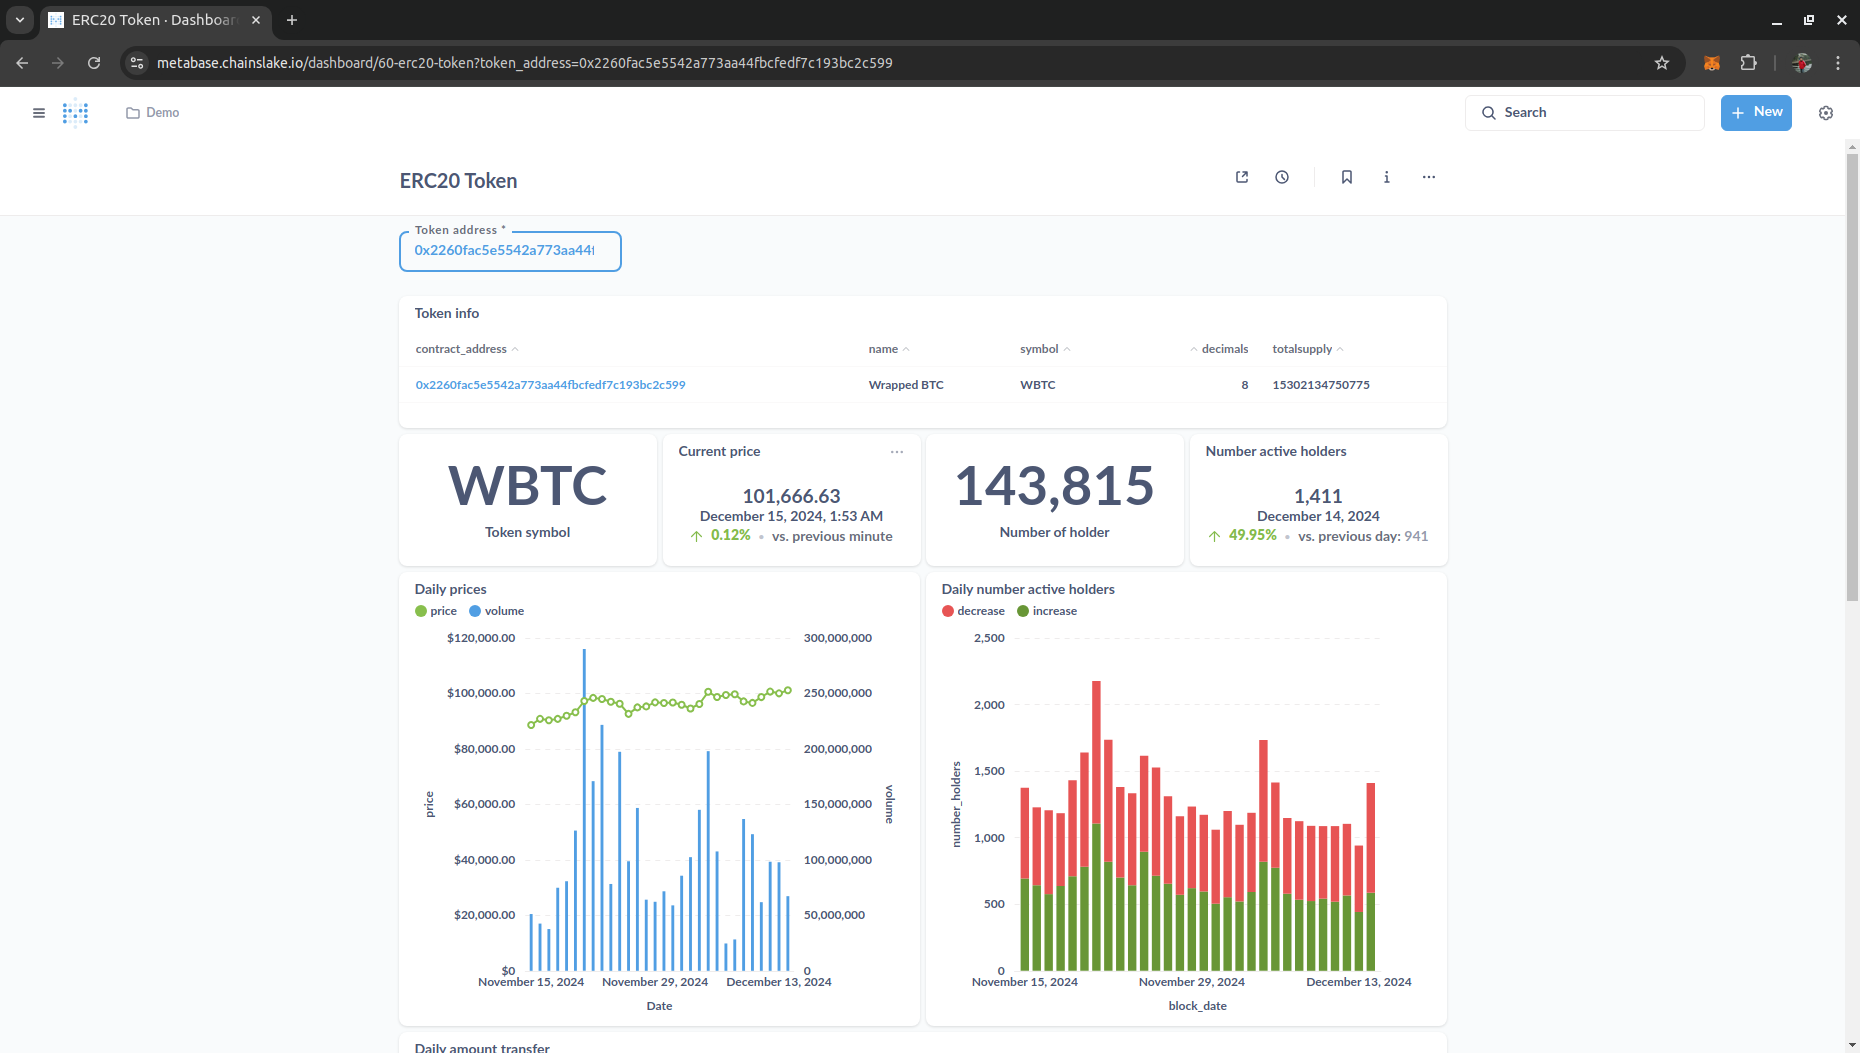
Some notes when writing queries:
-
The data tables all have an extremely large number of records (because they contain all historical data), so all tables are partitioned by
block_date, you should use this column to filter or join between tables whenever possible to help your queries run faster and more efficiently. - Using query optimization techniques, reducing the amount of data that needs to be scanned when executing queries always needs to be carefully considered to ensure that the query can be executed within the allowed time, and this also helps you improve your ability to write and optimize queries.
-
Query results will be automatically cached for 1 day, you can change in the configuration of each query.
- Finally, don’t forget to share your dashboards with everyone so that Chainslake can have more users.
Conclusion
Above are my shares on how to build a data analysis dashboard on a data warehouse, I hope to receive support from all of you. See you again in the next articles.
